CloudPi helps FinOps, finance, and engineering teams understand AWS, Azure, and GCP costs in one unified view so they can improve accountability, catch waste earlier, and act on savings opportunities faster.
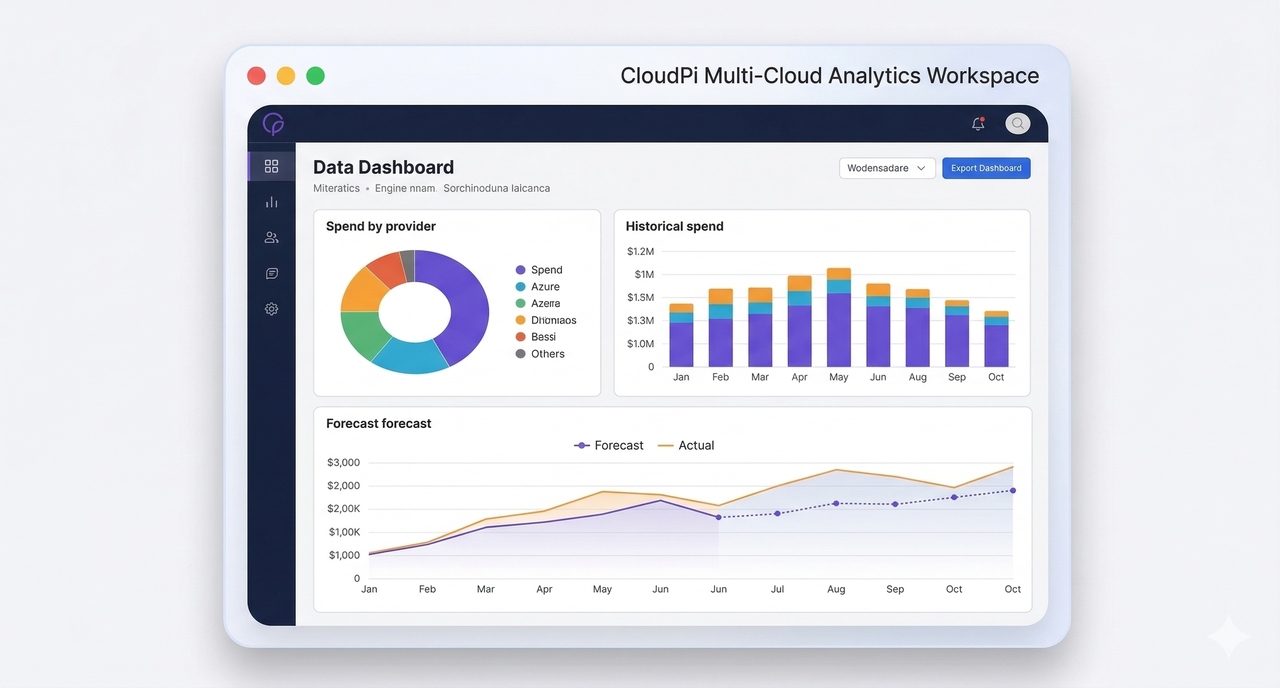
Real CloudPi analytics with spend visibility, forecasting, and savings signals in one workspace.

As organizations scale across AWS, Azure, and GCP, billing data gets split across different portals, formats, and ownership models. That makes it difficult to understand where spend is coming from, who is responsible for it, and what actions will actually reduce waste.
Separate AWS, Azure, and GCP billing views make it hard to see total spend and compare costs consistently.
Costs often cannot be clearly mapped to teams, projects, or business units, which weakens accountability.
Teams notice spikes too late when they rely on monthly billing exports instead of live analytics and anomaly signals.
Reports show what happened, but they rarely explain what should be fixed first or where savings can be achieved.
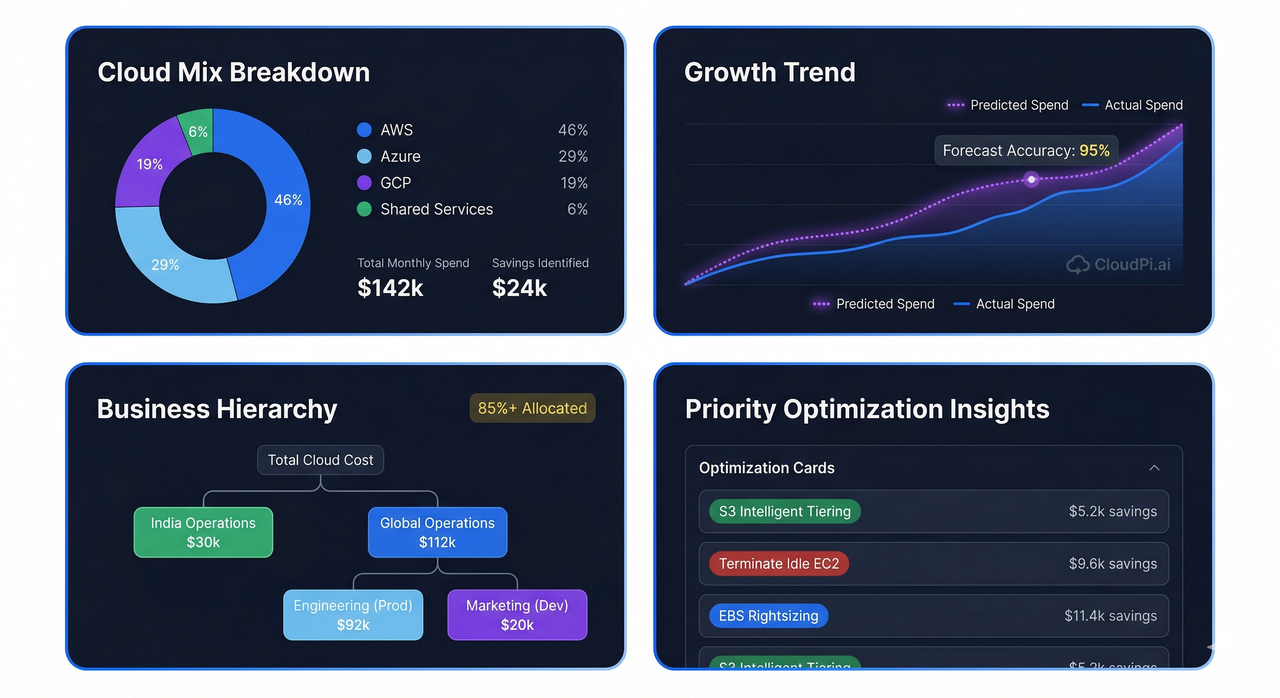
CloudPi combines billing data with business context so teams can move from raw cloud costs to real financial intelligence. Instead of only showing numbers, it explains what changed, who owns it, why it matters, and where optimization should happen next.
CloudPi brings together provider billing, usage patterns, tags, ownership rules, and business hierarchy in one model.
Costs are normalized, categorized, and explained in a way finance, FinOps, and engineering teams can all act on.
CloudPi highlights anomalies, forecast risks, and savings opportunities so action can happen faster and with confidence.
CloudPi connects data, ownership, and optimization in one clear workflow.
CloudPi combines billing, usage, projects, providers, and ownership into one financial model.
Teams can understand what changed, which service or owner is responsible, and whether the trend is expected.
Unusual cost increase identified.
Mapped to team and resource group.
Prioritized savings recommendation.
Instead of just reading reports, teams get accountability, forecast confidence, and a clearer path to savings.
Each capability is designed to solve a real cost management problem, from fragmented billing and weak ownership to late anomaly detection and missed savings opportunities.
Creates one unified view of spend across AWS, Azure, and GCP so teams no longer have to interpret disconnected billing systems.
Maps cloud spend to teams, projects, environments, and business units so responsibility is visible and chargeback is possible.
Predicts future spend using current usage patterns and trend history so finance and FinOps teams can plan ahead.
Flags unusual spikes and cost behavior early so teams can investigate before overruns grow into month-end surprises.
Identifies waste, rightsizing opportunities, and idle resources so teams know where savings can be achieved first.
Delivers role-based views for finance, FinOps, engineering, and leadership so each team gets the metrics relevant to them.
CloudPi gives teams a visual workspace where they can drill down into spend, filter by provider or owner, compare trends over time, and move from summary views into detailed investigation.
Go from summary to root cause.
Analyze cost by provider, account, service, team, or project without switching tools.Focus on exactly what matters.
Slice spend by time range, owner, environment, region, and cost category for faster analysis.Understand change with context.
Compare providers, periods, teams, and services to identify shifts, anomalies, and savings trends.The value of multi-cloud cost analytics is not just better reporting. It is better visibility, better savings identification, better forecast confidence, and faster response to cost anomalies.
Cost visibility coverage
Understand how much spend is clearly mapped to teams, projects, and business units.Monthly savings identified
Surface high-impact rightsizing, idle cleanup, and optimization opportunities faster.Forecast accuracy
Plan future cloud spend with greater confidence using trend-aware projections.Anomalies detected early
Spot unusual cost spikes before they become budget surprises or month-end escalations.CloudPi keeps the workflow simple so teams can move from fragmented cloud billing to clear financial action without adding more operational complexity.
Bring billing and usage data from AWS, Azure, and GCP into one analytics layer.
Apply tags, ownership rules, cost centers, and project mappings to connect spend with the business.
Track trends, forecast spend, and detect anomalies or unusual changes across providers and services.
Prioritize savings actions, improve accountability, and guide cost optimization with confidence.
CloudPi combines unified analytics, business-aware cost context, and optimization readiness in one platform so teams can move from visibility to action without stitching together multiple tools.
CloudPi surfaces insights that are structured for action, so teams can move from reporting to remediation without rebuilding the analysis manually.
CloudPi does not wait for perfect cloud tagging before delivering usable cost visibility. It combines billing, usage, ownership rules, and metadata to map spend faster.
CloudPi translates cloud cost data into business-facing analytics so finance, FinOps, and engineering can review the same spend through an operational and financial lens.
See how CloudPi helps your team understand cloud spend faster, improve cost ownership, and find savings opportunities across AWS, Azure, and GCP.